Scientific work

Research

My research covers image accessibility, multimodal fatigue detection and brain–computer interfaces. The first two areas are illustrated below with diagrams describing the methods used.

  1. Images and accessibility
  2. Multimodal fatigue analysis
  3. Brain–computer interfaces

Area 1

Making images and documents more accessible

A multi-granular approach transforms visual content into several levels of information that can be used visually, interactively or through tactile representations.
Application. Web and digital document access through alternative, multi-level and tactile representations.
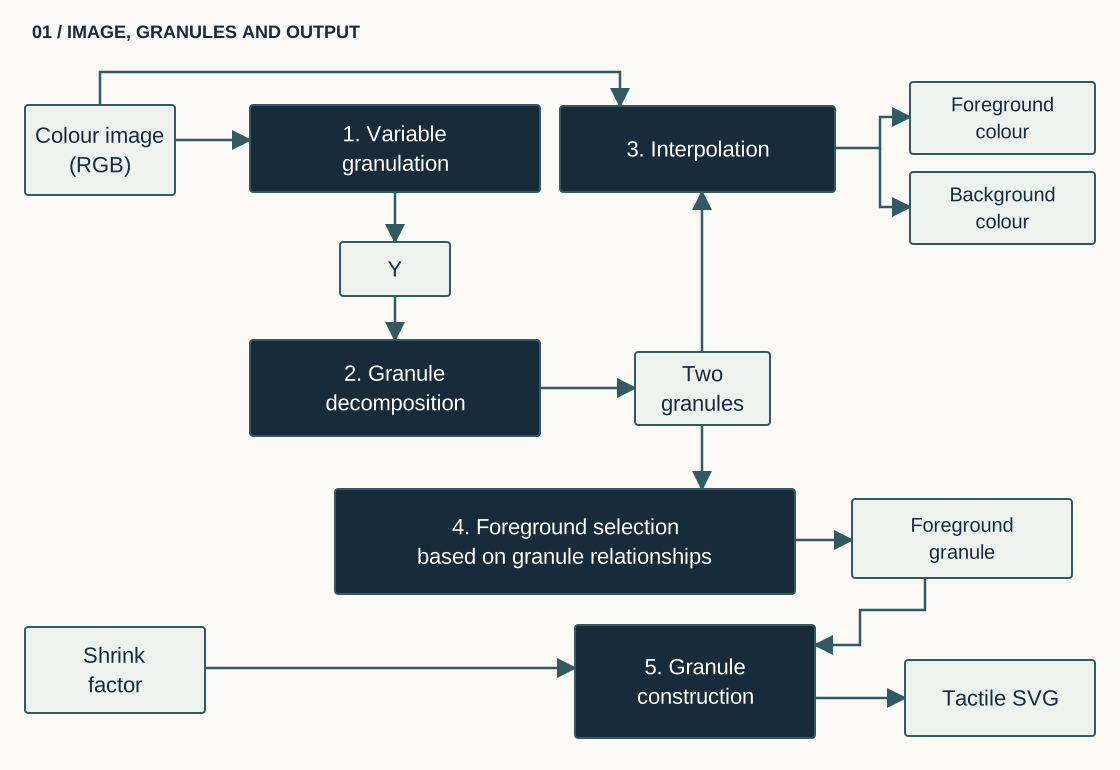
Adapting a colour image for visual and tactile output. A detailed description is available below the figure.
Figure 1. Adapting a colour image for visual and tactile output. The pipeline preserves two outputs: foreground and background colours, and granule construction for tactile SVG output.
Text description of figure 1
  • The RGB colour image feeds variable granulation (step 1) and a direct branch to interpolation.
  • The Y output of granulation enters granule decomposition (step 2), producing two granules.
  • These two granules feed interpolation (step 3), which outputs foreground and background colours.
  • They also feed foreground selection based on granule relationships (step 4).
  • The foreground granule and the shrink factor feed granule construction (step 5), producing a tactile SVG.
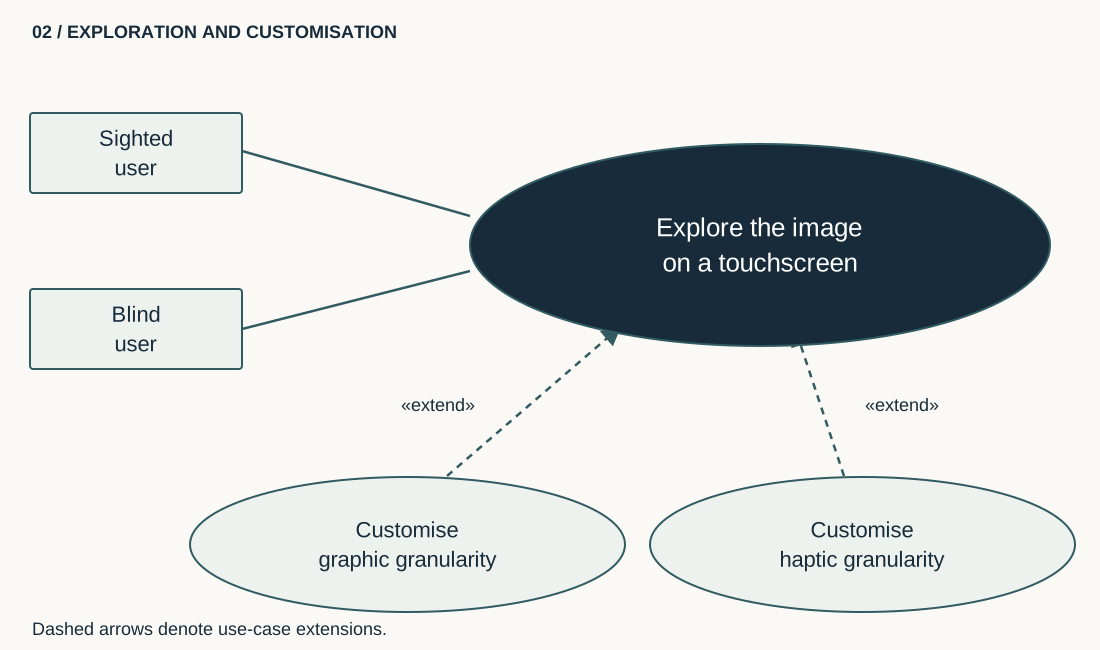
Image exploration and granularity settings. A detailed description is available below the figure.
Figure 2. Image exploration and granularity settings. Sighted and blind users share the same use case. Graphic granularity and haptic granularity can be customised.
Text description of figure 2
  • A sighted or blind user can explore an image on a touchscreen.
  • Two use cases extend this exploration: customising graphic granularity and customising haptic granularity.
  • The dashed UML “extend” relationships connect these customisations to the main use case. They do not indicate a sequence of steps.
Additional diagrams on granularity
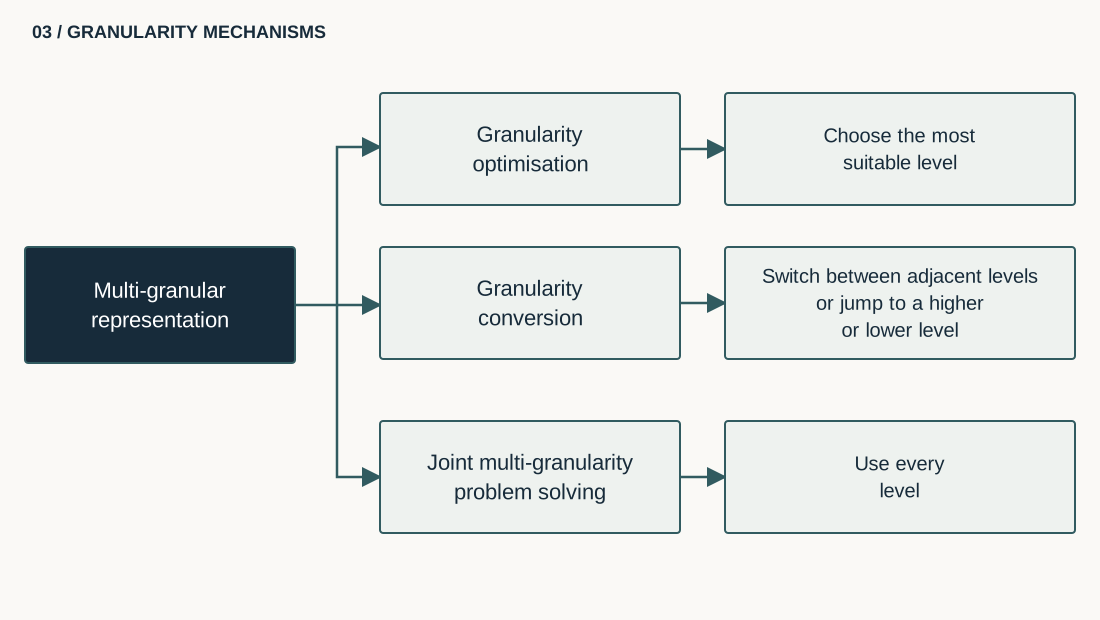
Choosing, converting or combining granularity levels. A detailed description is available below the figure.
Figure 3. Choosing, converting or combining granularity levels. Multi-granular representation supports selecting a suitable level, changing levels or using multiple levels to solve a problem.
Text description of figure 3
  • Granularity optimisation: choose the most suitable level.
  • Granularity conversion: switch between adjacent levels or jump to a higher or lower level.
  • Joint multi-granularity problem solving: use every representation level.
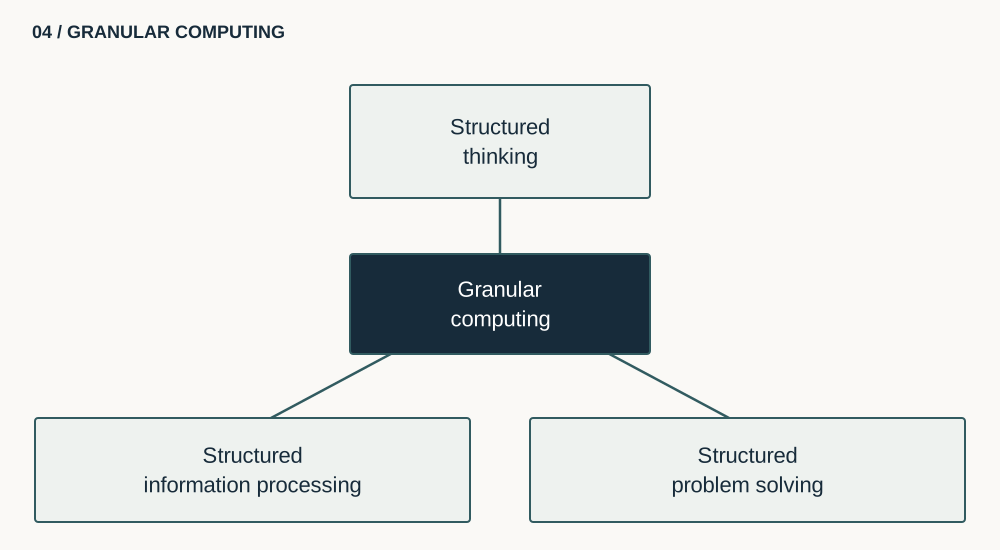
Dimensions of granular computing. A detailed description is available below the figure.
Figure 4. Dimensions of granular computing. Structured thinking, structured information processing and structured problem solving are three dimensions of granular computing.
Text description of figure 4
  • Granular computing is at the centre of the diagram.
  • It is associated with structured thinking, structured information processing and structured problem solving.
  • The connections express relationships between dimensions, without implying a chronological order or quantitative results.

Area 2

Detecting fatigue from multimodal data

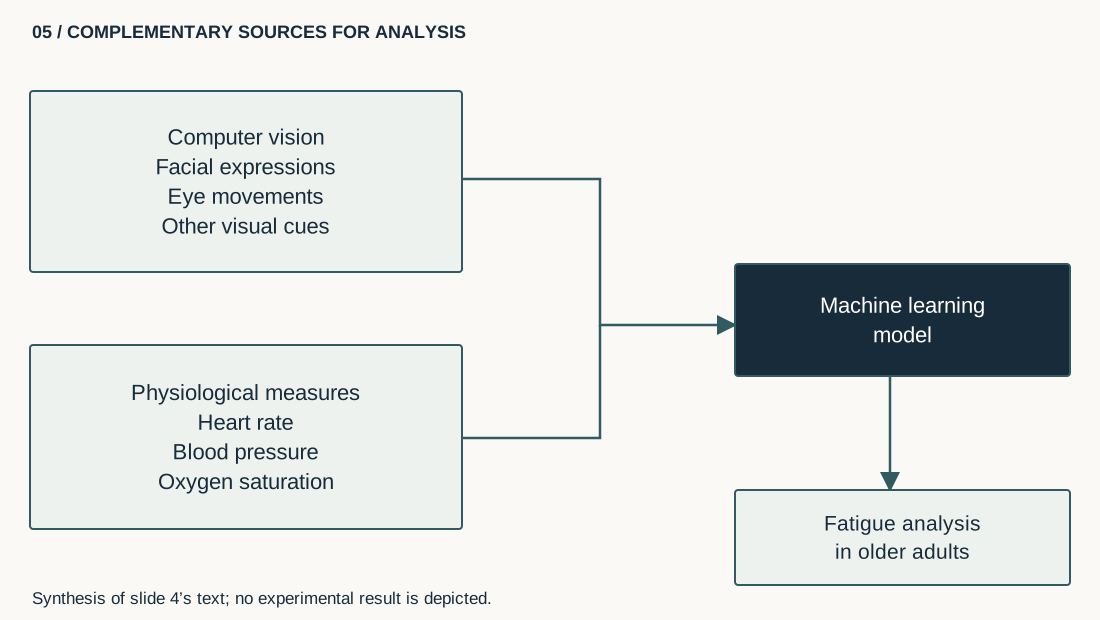
The methods combine computer vision, machine learning and physiological measures to extract complementary indicators.
Visual cues

  • facial expressions
  • eye movements
  • behavioural cues associated with fatigue

Physiological measures

  • heart rate
  • blood pressure
  • oxygen saturation
Visual and physiological data for studying fatigue. A detailed description is available below the figure.
Figure 5. Visual and physiological data for studying fatigue. Visual and physiological data provide complementary indicators to the machine-learning model.
Text description of figure 5
  • Computer vision extracts facial expressions, eye movements and other visual cues associated with fatigue.
  • Physiological measures include heart rate, blood pressure and oxygen saturation.
  • These complementary sources feed the machine learning model to study fatigue in older adults.
  • The document describes an approach. This diagram shows neither measured performance nor clinical validation.

Related work: Parallel Statistical and Machine Learning Methods for Estimation of Physical Load (2018).

Area 3

BCI, EEG and physical-action classification

Natural and synthetic data augmentation aims to improve deep-learning robustness when datasets are limited.

Participants
12
Trials
> 3,900
Sampling rate
500 Hz
EEG channels
32
EEG
Pre-processing
Natural & synthetic augmentation
Deep learning
Action classification
Potential applications: This work may contribute to more reliable human-activity analysis systems, including for people with very limited mobility.

Related work: Effect of Natural and Synthetic Noise Data Augmentation on Physical Action Classification by Brain–Computer Interface and Deep Learning (2025).

Scientific supervision

Research supervision

Research supervision in tactile accessibility and health-state prediction using machine learning.

Sami Rojbi · PhD defended in 2022

50% co-supervision in an international setting on adapting digital documents into tactile elements for people with specific needs.

Wiem Ben Ghozzi · ongoing since 2024

25% co-supervision of an international joint PhD on healthcare monitoring and prediction using machine-learning techniques.